The Biofuels Boom: Implications for World Food Markets
Warning: Undefined variable $tagger in /var/www/bioenergypro.com/public_html/bioenergy-articles/snews.php on line 2924
Warning: Undefined array key "https://www.bioenergypro.com/bioenergy-articles/Logged_In" in /var/www/bioenergypro.com/public_html/bioenergy-articles/snews.php on line 2999
Introduction
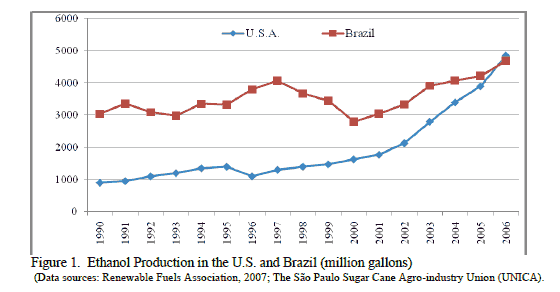
Interest in biofuels initially came about in the late 1970s as OPEC reduced crude oil supply on the world market and fuel prices increased substantially. Both the US and Brazil launched ethanol programs during this period. The US, EU, and Brazil all have subsidies or regulations promoting biofuels. In Brazil and the US, ethanol is the predominant fuel, and in the EU, it is biodiesel. Figure 1 shows US and Brazilian ethanol production over time. Until 2006, Brazil was the global leader in ethanol production, but with the developments in world oil markets plus US domestic policy described below, the US overtook Brazil in 2006. However, it is cheaper to produce ethanol from sugarcane, the resource used in Brazil, than to produce it from corn, the raw material currently used in the US. The energy balance also is much more positive for sugarcane based ethanol than for ethanol from corn. Therefore, in the absence of government intervention, we would expect Brazilian ethanol to be dominant.
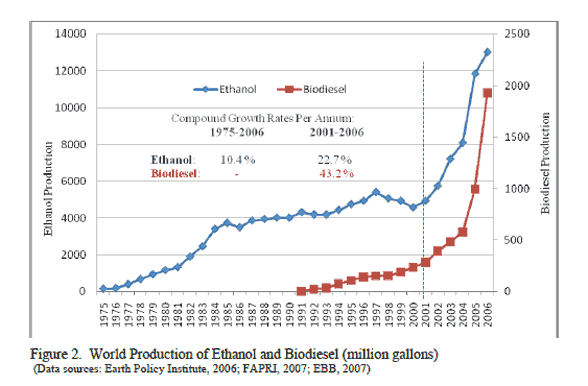
The European Union Biofuels Directive requires that member states should realize 5.75% share of biofuels on the liquid fuels market by 2010 (Commission of the European Communities, 2003). Biodiesel production has been a more recent addition to the global biofuels scene, as shown in Figure 2 (note the difference in scales for the two types of biofuels). Germany is the largest producer (798 million gallons constituting about 54% of EU-27’s total biodiesel production in 2006) followed by France (15%), Italy (9%), United Kingdom (4%), Austria (2.5%), Poland (2.4%), Czech Republic (2.2%), Spain (2%), and others (9%) (European Biodiesel Board). The spectacular growth in the German market is the result of a very favorable legislation granting a total tax exemption for biofuels. This exemption is particularly important in the EU, where fuel taxes are extremely high.
In the US, subsidization of ethanol began with the Energy Policy Act of 1978. At the time, the main arguments that were used to justify the subsidy were enhanced farm income and, to a lesser extent, energy security. In 1990, the Clean Air Act was passed, which required vendors of gasoline to have a minimum oxygen percentage in their product. Adding oxygen enables the fuel to burn cleaner, so a cleaner environment became an important justification for ethanol subsidies. Since ethanol has a larger percentage of oxygen than standard gasoline, or methyl tertiary butyl ether (MTBE), its main competitor in the additive market, demand for ethanol as an additive offered good prospects. However, MTBE is produced from petroleum products by oil companies and was generally cheaper than ethanol, so it continued to be the favored way of meeting the oxygen requirements throughout the 1990s.
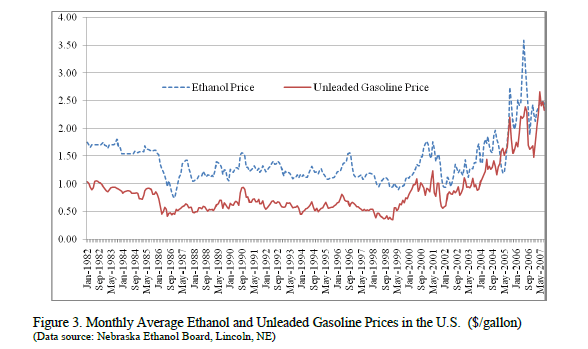
This growth in MTBE use was, however, short-lived, as it began to crop up in water supplies in several regions in the country. Since MTBE is highly toxic, it was subsequently banned by about 20 states. That left ethanol as the major source of added oxygen in those states by the early 2000s. Two years ago, Congress debated and ultimately passed the Energy Policy Act of 2005. During the debate, oil companies lobbied to be given exemption from legal liability from MTBE issues. Congress did not grant the legal liability exemption but did agree to remove the oxygen requirements leaving oil companies free to meet the clean air rules in any way they saw fit (ethanol, reformulated gasoline, etc.). The US Environmental Protection Agency issued rules eliminating the oxygen requirement as of May 8, 2006. Oil companies generally believed they had legal cover for MTBE so long as the government was requiring them to meet a minimum oxygen requirement. But with the removal of the oxygen requirement, companies no longer had that legal cover and made a big push to use ethanol in its place. Figure 3 shows the monthly average historic ethanol and gasoline prices. Ethanol peaked at $3.58/gal. in June 2006 shortly after the May rule change occurred. Much, but not all, of this huge price swing was due to this change in rules and legal liability. Since that time, the price of ethanol has been falling, as the demand for ethanol as an additive has become satiated, and ethanol is increasingly priced for its energy content.
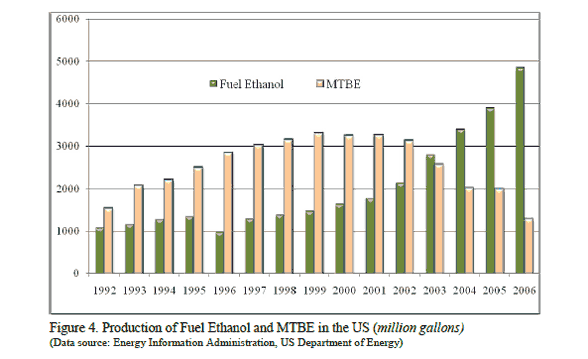
During the 20 years between 1983 and 2003 the US ethanol subsidy varied between 50 and 60 cents per gallon. Today it is 51 cents per gallon on a volumetric basis and equivalent to 75 cents per gallon of gasoline on an energy basis. Over that time period, crude oil ranged between $10 and $30 per barrel with a couple of short exceptions. Figure 4 shows the growth of US ethanol production and coincident decline in MTBE production during the 1992-2006 period. The subsidy was sufficient to ensure a profit except for a few months in 1996 when corn prices reached record high levels. However, the subsidy was not enough to create rapid growth in the industry. That subsidy, together with oil in the $10 to $30 range was sufficient to permit steady growth in ethanol production from about 430 million gallons (1625 mil. l.) in 1984 to about 3.4 billion gallons (12.85 bil.l.) in 2004. In other words, production grew by about 149 million gallons (563 mil. l.) per year over this period. In 2004, the crude oil price began its steep climb to around $70/bbl, and it has been hovering between $60 and $80/bbl in recent months. This rapid increase in the crude price, together with an exogenously fixed ethanol subsidy, led to a tremendous boom in the construction of ethanol plants. Ethanol production in 2005 was about 4 billion gallons (15.1 bil. l.), and it will be around 8 billion gallons (30.2 bil. l.) in 2007, likely surpassing 11 billion gallons (41.6 bil. l.) in 2008. At this point, we expect it to make use of over 30 percent of the US corn crop.
Production will have grown by about 1.9 billion gallons (7.2 bil. l.) per year over that four year period compared with 149 million gallons in the preceding years. It has been, then, the combination of high oil prices, a shift in the demand for ethanol as a fuel additive, and a subsidy that was keyed to $20 oil that has led to this boom in US ethanol production.
Will the US Boom Last?
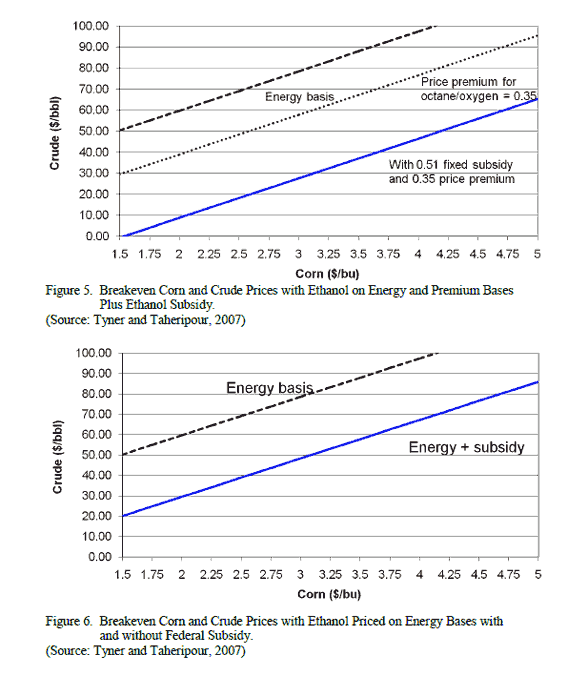
We can illustrate these three key drivers of recent growth in the ethanol market with the break-even graphs shown in Figure 5. The top panel in Figure 5 provides the locus of breakeven points between crude oil and corn prices under three different assumptions:
A1) The top line in the graph assumes there is no ethanol subsidy and that ethanol is priced on an energy equivalent basis with gasoline.(All the assumptions and econometric estimations used in producing this graph are contained in Tyner and Taheripour, 2007.) Figure 6 is a similar graph but eliminates the additive value and thus has energy equivalent pricing with and without the federal subsidy. For $60/bbl oil, the energy, additive, and additive plus subsidy breakeven corn prices are $2.01, $3.12, and $4.72/bu. ($79, $123, and $186/mt) respectively. If there is no additive value, the energy plus subsidy breakeven is $3.62/bu. ($142/mt) at $60 oil.
A2) The second line assumes no subsidy again but that there is a 35 cent per gallon additive value for ethanol.
A3) The third line adds the 51 cent per gallon federal ethanol subsidy.
Clearly, so long as ethanol has a considerable additive value, ethanol production will continue to grow until corn reaches about $5/bu. ($197/mt). But if ethanol is priced on an energy equivalent basis (as it would be for E-85 blends for example) and the current policy regime remains in place, then investment would cease at corn prices not much higher than they are today. We expect that the additive market will be saturated by the end of this year, so energy equivalent pricing is much more likely for the future. This suggests that the biofuel boom in the US may soon be coming to an end.
The ethanol boom has, in turn, led to a rapid run-up in corn and other commodity prices in 2006-07, as land has been diverted from these crops to corn (soybeans, in particular. The run-up in commodity prices has fueled debate over the food-fuel issue and raised questions on the extent to which renewable fuels can be supplied from corn alone. In a year’s time the price of corn went from $2.20/bu. ($87/mt) to $3.50/bu. ($138/mt) or higher – an increase of 60 percent. Soybean prices went up even more as there were massive shifts in soybean acreage to corn. This is not to say, however, that food prices will increase in like proportion. Corn is used primarily as an animal feed, with the proportion varying by animal species. Poultry meat and eggs are facing the largest shock as corn constitutes about two-thirds of the poultry ration. As a consequence, the total cost of producing poultry meat and eggs has increased by about 15 percent over this period. It is unlikely, however, that all this cost increase can be passed on to consumers. For other commodities, the cost increase is smaller, and it is substantially smaller for the total consumer food bill. Recent estimates put the consumer food bill increase to date, due to corn ethanol, between 1.1 and 1.8 percent (Tokgoz et al., 2007). But in terms of the annual food bill, Alexander and Hurt (2007) estimate that US consumers will pay $22 billion more for food in 2007 due to biofuels.
As indicated above, corn ethanol production is likely to reach 11-12 bil. gal. (42-45 bil. l.) in 2008. In a remarkable response to this increased demand and favorable prices, US corn acreage went from 78 million in 2006 to 92 million acres in 2007. Most of that acreage increase came at the expense of soybeans, thereby driving soybean prices substantially higher. How much higher will ethanol production go and what will be the determining factors? Most industry and agriculture experts (Tokgozet al., 2007) figure corn ethanol production will top out around 15 bil. gal. (57 bil. l.) by 2012. This would constitute 10 percent of projected US gasoline consumption (US Energy Information Administration) by volume and about 7 percent on an energy equivalent basis. The volumetric and energy equivalent shares are different because ethanol contains about 68 percent of the energy of gasoline per unit volume. Miles per gallon, at least in the short run, will be determined by energy content, so consumers are unlikely to be willing to pay more for ethanol than its energy equivalence to gasoline once it is widely known that ethanol blends yield lower fuel economy than gasoline alone. This suggests that there is limited scope for increasing the price of ethanol unless petroleum prices rise substantially.
In summary, we believe that, without substantial further increases in the world price of petroleum, the US biofuel boom based on corn will gradually come to a halt, with total capacity settling in at about 15 billion gallons – nearly double current levels. Much of this capacity is currently under construction and will come on line in the next year or two. Indeed, progress on some of these ethanol plants has recently been delayed due to the sharp decline in ethanol prices over the past month. Excess production capacity, relative to the absorptive capacity of transport infrastructure and the ability of the liquid fuel market to absorb the additional ethanol being produced for energy substitution, is having an adverse near term effect on this market. Nonetheless, factoring in the capacity already nearing completion, ethanol demand in the US represents a very substantial claim on corn production. When coupled with mandates in the EU, and potential subsidies for biofuels elsewhere around the world, this could have a very substantial impact on the long run patterns of global food and agricultural production and trade.1 The remainder of this paper seeks to investigate this link between increased biofuel production and food trade.
Implications of Biofuel Growth in the EU and US for World Food Markets
Methodology: In order to draw the link between developments in US biofuels and food trade, we need a formal modeling framework. And we aim to simultaneously include the EU biofuel mandates in this analysis. To do so, we require a global model. A detailed description of the model used in this analysis is offered in Birur, Hertel and Tyner (2007).
Key features include:
(a) the incorporation of biofuels into the GTAP-E global energy data base and model,
(b) extension of the latter to a broader set of regions and agricultural commodities, and
(c) the addition of Agro-ecological Zones (AEZs) for each of the land using sectors, following the methodology outlined in Lee et al. (2005).
In the US, we distinguish between the demand for ethanol as an additive, and the demand for ethanol as an energy substitute. Extension of the energy model to encompass agricultural products to highlight key agricultural exporters is critical for understanding the food market impacts of the biofuels boom. And finally, the more refined treatment of the global land data base is essential since corn, for example, competes with different crops in different parts of the US. As noted above, the expansion of corn for use in ethanol has had a much larger impact on soybeans than on other crops. By disaggregating the global land endowments by AEZ, we are able to take account of this dimension of land competition.
As part of our effort to project the biofuel economy forward in time, we began by comparing model results against recent history. Since, the initial year for our data base is 2001, we use the intervening period: 2001-2006 for an historical simulation. It is not possible to introduce all of the exogenous changes to the global economy that occurred over this period. So we focus on three key elements of the US biofuels boom: the petroleum price hike, the replacement of MTBEs by ethanol in gasoline additives, and the ethanol subsidy. We use this historical simulation to “fine-tune” the elasticity of energy substitution between biofuels and petroleum products in each region. In the US, we set the elasticity of substitution between ethanol as an additive and petroleum products equal to zero, assuming that ethanol’s use in this role is largely determined by factors exogenous to our model (the state-level bans, combined with federal legislation). On the other hand, we set this elasticity of substitution between ethanol and petroleum products in energy usage equal to 3.0. This value, when combined with the shock to petroleum price (as well as exogenous growth in additive demands), results in a model-predicted ethanol growth rate of 181% over this period. (We do not expect these to be precisely the same, due to other changes in the global economy that are not accounted for in our historical simulation.) In the case of the EU, we reduce this slightly – to 2.75 – to permit the model to closely replicate growth in EU biodiesel output over the 2001-2006 period (model prediction is 420% vs. observed growth of 409%). Finally, in Brazil, the other major biofuels market, we reduce this elasticity of substitution to just 1.0. Even so, we over-predict the growth in Brazilian ethanol output in this historical simulation (43% predicted vs. 25% actual). This is likely due to the surge in sugar prices in the latter years of this historical period. As a consequence, Brazil did not have as strong an incentive to divert sugar to ethanol production by 2006. Also, a very large share of sugarcane in Brazil is already going to ethanol, so the potential for large percentage increases is diminished.
With these parameter settings, the model does a reasonably good job reproducing the major changes in biofuels and related markets in 2006, based solely on the oil price shock, and the two US-specific shocks: additives demand and the subsidy (for more details, see Birur, Hertel and Tyner, 2007). For example, the predicted share of US corn going to ethanol in 2006 is 17%, which is about the same as the observed value. Predicted corn output in the US rises by 7% (as opposed to 11% in reality). And predicted wheat and soybean production falls – as is broadly observed over this period (the decline in US soybean production doesn’t materialize until 2007). Again, the reader should bear in mind that this 2006 equilibrium is purely hypothetical, since we have not introduced all the other intervening changes to the economy between 2001 and 2006.
Scenarios for Future Biofuel Production: As noted in the introduction, both the European Union and the United States have recently announced biofuel targets. In the EU, the goal is to reach 5.75% of energy used in transportation by 2010. Compared to reported biofuel use in 2006, this entails a 281% increase in biofuels’ share of liquid fuel consumption (Table 1). We apply this mandate equally to biodiesel as well as ethanol in the EU. In the US, the President’s proposal targets 35 billion gallons of biofuels by 2017. We estimate that ethanol capacity will reach 13.4 billion gallons by 2010, which amounts to a 177% boost in ethanol production (Table 1). We adopt this as our target in this “mandates” simulation. Importantly, we do not include bio-diesel in this US mandate.
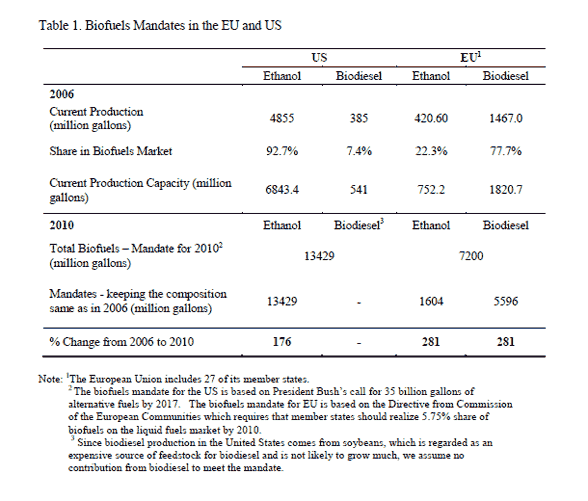
US Impacts: The strong expansion in ethanol production envisioned under our 2010 scenario more than doubles the share of US corn going to ethanol production – from 16% of total sales in our 2006 data base, to 38% of total sales in the projected 2010 data base (Table 2). This increased share comes primarily at the expense of corn going to feed use and exports, which decline by 6% and 48%, respectively. The share of US coarse grains production exported falls from 23% in our 2006 baseline to 10% under the mandates scenario (Table 2), as the price of US corn nearly doubles under this scenario. The change in output following the implementation of the mandate, is given in terms of domestic and exports components (Table 3). In US, only production of coarse grains goes up by 14% which mainly comes from 25% increase in demand for domestic use, coupled with decline in exports by 11%. The production of all other agricultural commodities goes down substantially. Meanwhile, the share of production going to feedstuffs falls from 43% to 37%. This contraction of other uses, coupled with a 14% increase in corn output, permits ethanol production to rise by 174%, as mandated in our 2006-2010 simulation scenario.
The increase in corn output is met largely by increases in land used for coarse grains. (There is also a marginal increase in yields as a result of more intensive cultivation practices.) Figure 7 shows a map of the world, with the percentage change in coarse grains acreage, by AEZ and region. The percentage increase in acreage varies by AEZ, with the rise in the US Corn Belt being about 10%. The largest percentage changes in corn acreage (up to 25%) are in the less-productive AEZs which contribute little to national coarse grains output. Thus the productivity-weighted rise in coarse grains acreage is close to the Corn Belt figure and is just 11% (see Table 4). This table also reports the productivity-weighted change in average land use for the other land-using sectors. In the US, it is clear that all of them give up land for coarse grains. Figures 8-10 plot these land use changes, by region and AEZ, for a selection of the other sectors (oilseeds, sugar, and forestry, respectively).
EU Impacts: Next we turn to the projected impacts in the EU. Here, the mandate represents a much larger change in percentage terms. The 281% increase in biofuel production is largely biodiesel, and this generates a strong demand for oilseeds, the production of which rises by 26% in response to a doubling of oilseed prices in the EU. This increase in production is far less than the required rise in use by the biodiesel sector, which is about triple this amount (nearly 80% of current production), and the difference is made up by increased imports of oilseeds as well as the virtual elimination of exports by the EU oilseeds sector. Thus the EU biofuel mandate has a very strong impact on international agricultural trade.
The anticipated impacts on land use and outputs by the land-using sectors in the EU are also shown in the world maps in Figures 8 - 10. In order to meet the increased domestic production of oilseeds, oilseeds acreage rises across the board, with the increases ranging from 7% to more than 30%, depending on the AEZ, with the overall productivity-weighted average for land used in oilseeds rising by 12%. This land comes out of other grains, livestock and forestry, as the coarse grains and sugar acreage expands slightly, the price rises following the ethanol boom (Table 4).
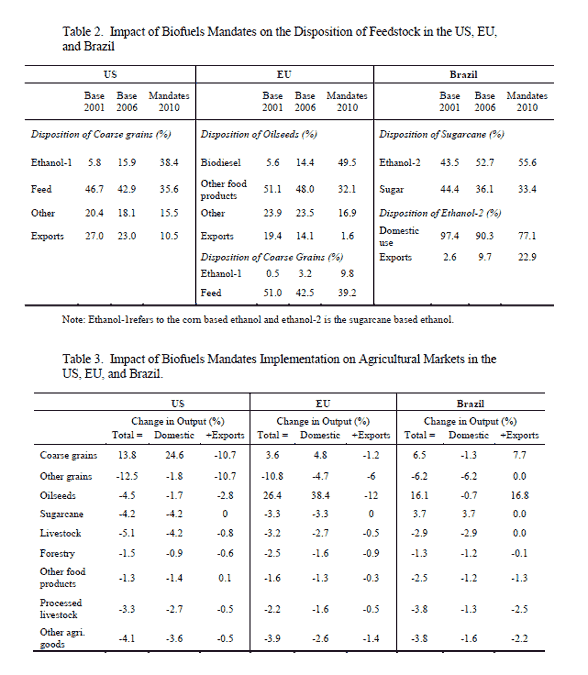
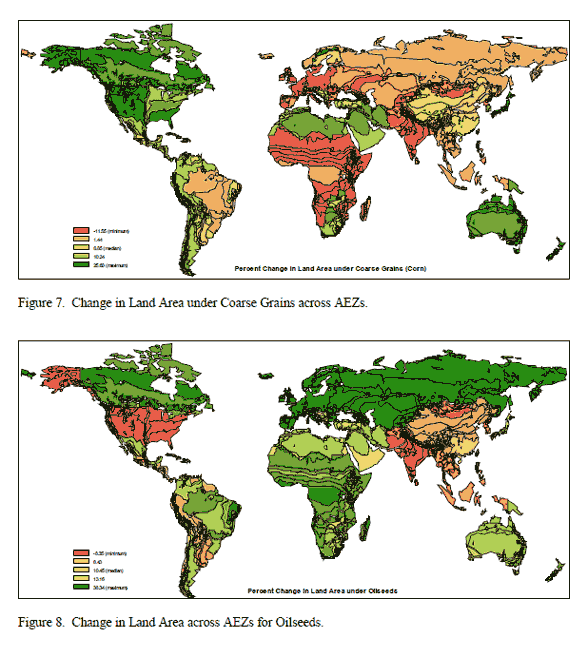
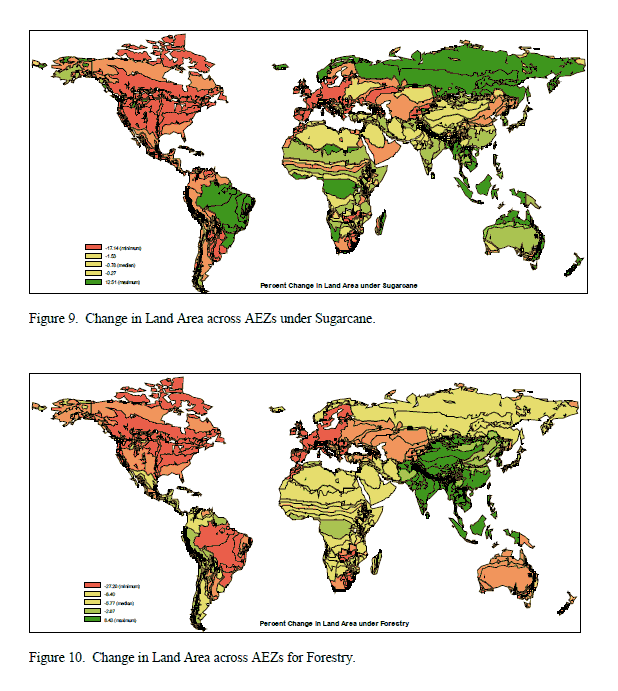
Brazilian Impacts: Given her importance in the global biofuels picture, it is also important to examine the impacts of EU and US biofuel mandates on the Brazilian economy. The third panel of Table 2 reports some key changes in the food and biofuel economy of Brazil. The share of sugar going to ethanol rises as output of the latter increases, as does the share of this ethanol output exported. However, the strongest percentage output response is not in sugarcane, but rather it is in oilseed production (Table 3), followed by ethanol, coarse grains and then sugar cane.2 With the increased demand for grains, oilseeds and sugarcane, Brazilian land prices experience a veritable boom – more than doubling, and nearly tripling in some regions. This sends a strong signal to shift land use into these commodities, and this is what we see happening in Figures 8 - 10. Other grains (rice and wheat), livestock, and especially commercial forestry, show sharp reductions in land use. From these maps it is clear that the combined impact of biofuel mandates in the US and EU could place considerable pressure on the Amazon forest in Brazil – although our analysis has not taken into account non-commercial (presently inaccessible) forests. Impacts on Regional Trade Balances and the Terms of Trade: Of course in the aggregate, global trade must balance, and each region’s current account must be equated to its capital account, and the latter changes little as a result of the biofuel mandates, so any increase in regional import value must be largely offset by an increase in exports. Thus the US farm and food sector shows a negative change in trade balance. This is offset by a positive change in the trade balance for oil and oil products, as biofuels substitute for petroleum products. In addition, there is a positive change in the trade balance for other manufactures and services, so that in the aggregate, the US trade balance improves. The story in the EU is quite similar to the US, with a deteriorating trade balance in agriculture being offset by an improvement in non-agriculture. The big difference is the relative importance of petroleum products vs. manufactures and services. In the case of the EU, it is the latter that dominates the improved non-agriculture trade balance – as opposed to oil and oil products in the US. Sectoral trade balances in Canada and Brazil, and indeed most of the other economies, mirror the patterns in the US and EU. There, agri-food exports rise relative to imports, as agricultural prices rise and the EU and US demand more imports. On the other hand, falling oil prices and reduced demand in the biofuel mandate economies, combine to result in deteriorating trade balances for the oil exporting regions.
Qualifications and Directions for Future Research
The application of global, general equilibrium analysis to biofuels policy is still in its infancy. First and foremost among the challenges facing researchers in this area is the problem of data. Since biofuels are not explicitly broken out in the GTAP data base (Dimaranan, ed., 2007), in order to conduct this research, we had to disaggregate the biofuels sectors, including the complete pattern of sales and purchases for these industries. The latter is critical when it comes to the transmission of (e.g.) the EU biofuels mandate to the feedstock markets. Specifically, we have not yet successfully established the link between palm oil, which is a prime feedstock for biodiesel, and the EU mandates. At present, all of the impact in our analysis is transmitted to the oilseed crops market. An additional data challenge lies in properly identifying current and potential patterns of biofuels trade, as well as the barriers facing such trade flows, as these will play a key role in determining the global impact of future biofuels policies.
Close behind the data challenge is the need for a new set of behavioral parameters governing the responsiveness of biofuel demand to changes in the price of petroleum. We have chosen this key elasticity of substitution in the model to replicate the 2001-2006 historical experience. However, more formal econometric estimation of this parameter would be preferable.
We have also struggled to properly characterize some of the policies affecting biofuels use. By way of getting started, most of our attention has been focused on the US, where we have found the separation of additive demands from energy substitution to be of paramount importance. The former has largely been driven by legal rulings regarding the competitor additive (MTBE), while the latter demand has been driven by the price of ethanol relative to petroleum, as well as the ethanol subsidy. Similarly detailed policy analysis in the other major biofuel markets is also required.
With these improvements in hand, we believe that there are a large number of interesting areas of research opening up in this area. The interaction between energy and agricultural markets is just one of these. Extending the analysis to consider the impact, not just on trade, but also on household welfare, and poverty in particular, is of considerable interest. A majority of the world’s poor relies, either directly or indirectly, on agriculture for their incomes. Thus they would appear to be poised to benefit from higher returns to farming. However, the poor also spend a large share of their income on food, and food prices rise as a result of these biofuel mandates. Therefore, the net impact on poverty is uncertain and likely will differ from region to region.
Another important area of research pertains to the implications of these developments for global greenhouse gas emissions. By their very nature, biofuels offer some potential benefits in terms of reduced CO2 emissions. However, the net greenhouse gas impacts vary substantially by type of biofuel and production conditions. Some argue that increased NOx emissions are important for some biofuels. Also, the methods used to produce and transport the feedstocks are themselves often quite energy intensive, and therefore a comprehensive analysis is required to determine the net impact of such biofuel mandates on emissions. As Rajagopal and Zilberman (2007) and Tyner (2007c) made clear, there are many unresolved yet extremely important research issues in this area. A global general equilibrium approach, such as the one employed here, is well-suited to addressing many of these issues.
by
Dileep K. Birur, Thomas W. Hertel, Wallace E. Tyner - Center for Global Trade Analysis, Department of Agricultural Economics, Purdue University
This article hasn't been commented yet.


Write a comment
* = required field